 |
|
|
| |
|
|
This Masterclass describes how to bias simulations to agree with experimental data using experiment directed simulation.
Once this Masterclass is completed, you will know how to:
We assume that you are familiar with PLUMED and enhanced sampling calculations. If you are not, the 2021 PLUMED Masterclass is a great place to start. In particular, you should be familiar with specifying collective variables.
Furthermore, some Python or other programming knowledge is required for this masterclass to generate plots and perform some analysis calculations.
Experiment directed simulation (EDS) is a maximum entropy method for biasing specific collective variables (CVs) to agree with set values. These are typically from experimental data, like a known radius of gyration or NMR chemical shift. Biasing a CV is an under-determined problem because there are many ways to change the systems' potential energy to agree with a set point. If we further maximize ensemble entropy while matching the set point, the problem has a unique solution of
\[ U'(x) = U(x) + \lambda f(x) \]
where \(U(x)\) is the potential energy of the system, \(f(x)\) is the CV, and \(\lambda\) is a fit parameter. EDS is a time-dependent method that finds \(\lambda\) while the simulation is running. It typically converges much faster than free-energy methods, but comes with the same caveats that insufficient sampling or rare events can affect the method. Another important detail is that EDS/maximum entropy biasing is for matching the set point on average (in expectation), rather than at every frame.
The only data needed to complete the exercises of this Masterclass can be found on an the following github page data, with alanine inputs being borrowed from an earlier one GitHub-22-03. Simulations will be performed using PLUMED's pesmd module, and gromacs.
The exercises are presented below.
Set up a plumed file to use with pesmd that has a harmonic potential. Then run using the 1d input provided in the github. For example:
d1: DISTANCE ATOMSthe pair of atom that we are calculating the distance between. =1,2 COMPONENTS( default=off ) calculate the x, y and z components of the distance separately and store them as label.x, ff: MATHEVAL ARGthe input for this action is the scalar output from one or more other actions. =d1.x PERIODICcompulsory keyword if the output of your function is periodic then you should specify the periodicity of the function. =NO FUNCcompulsory keyword the function you wish to evaluate =0.5*10*(x^2) bb: BIASVALUE ARGthe input for this action is the scalar output from one or more other actions. =ff PRINT ARGthe input for this action is the scalar output from one or more other actions. =d1.x STRIDEcompulsory keyword ( default=1 ) the frequency with which the quantities of interest should be output =25 FILEthe name of the file on which to output these quantities =_PREFIX_.colvars.dat
plumed pesmd < harmonic_1d.in
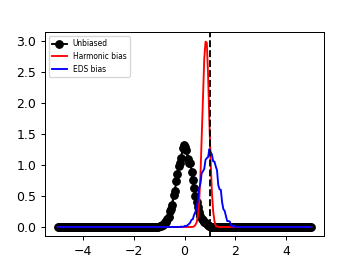
Histogram your data, and see if it fits the ideal Boltzmann distribution for this harmonic oscillator. Make sure to normalize your distribution properly!
Now try adding a harmonic bias using the RESTRAINT function, so that the data becomes centered near \(x=1\).
Finally, we will add an EDS bias. Make your EDS bias also be centered at 1.
d1: DISTANCE ATOMSthe pair of atom that we are calculating the distance between. =1,2 COMPONENTS( default=off ) calculate the x, y and z components of the distance separately and store them as label.x, ff: MATHEVAL ARGthe input for this action is the scalar output from one or more other actions. =d1.x PERIODICcompulsory keyword if the output of your function is periodic then you should specify the periodicity of the function. =NO FUNCcompulsory keyword the function you wish to evaluate =0.5*10*(x^2) bb: BIASVALUE ARGthe input for this action is the scalar output from one or more other actions. =ff eds: EDS ARGthe input for this action is the scalar output from one or more other actions. =d1.x CENTERThe desired centers (equilibrium values) which will be sought during the adaptive linear biasing. =__FILL__ PERIODSteps over which to adjust bias for adaptive or ramping =__FILL__ OUT_RESTARTOutput file for all information needed to continue EDS simulation. =__FILL__ TEMPThe system temperature. =1.0 BIAS_SCALEA divisor to set the units of the bias. =1 PRINT ARGthe input for this action is the scalar output from one or more other actions. =* STRIDEcompulsory keyword ( default=1 ) the frequency with which the quantities of interest should be output =100 FILEthe name of the file on which to output these quantities =_PREFIX_.colvars.dat
Note, we have to add TEMP=1 because pesmd does not provide the temperature to the EDS module.
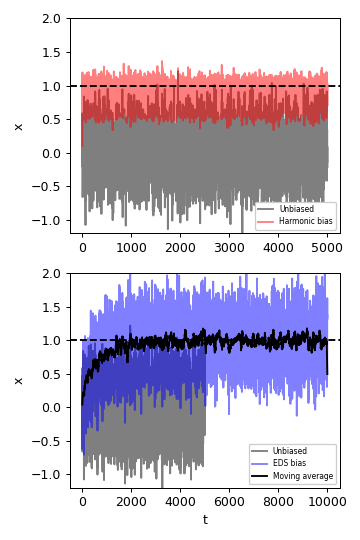
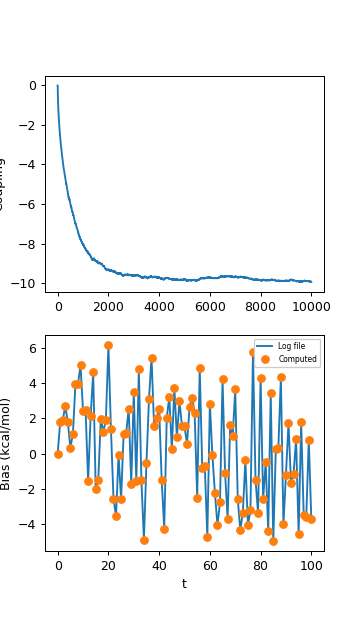
Now look at how the bias factor changes with time. Can you also compute the bias from this value, and the value of the position versus time? Look in the colvar file and the restart file to see what values are there.
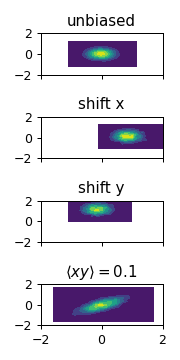
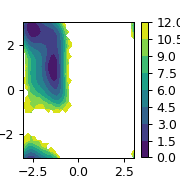
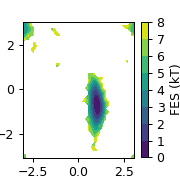
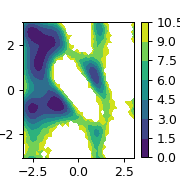
Now we will move on to a 2d harmonic oscillator. This way we can see the effect of biasing x, y, or a combination. Note, there is a different pesmd input file for this.
d1: DISTANCE ATOMSthe pair of atom that we are calculating the distance between. =1,2 COMPONENTS( default=off ) calculate the x, y and z components of the distance separately and store them as label.x, ff: MATHEVAL ARGthe input for this action is the scalar output from one or more other actions. =__FILL__ PERIODICcompulsory keyword if the output of your function is periodic then you should specify the periodicity of the function. =NO FUNCcompulsory keyword the function you wish to evaluate =__FILL__ bb: BIASVALUE ARGthe input for this action is the scalar output from one or more other actions. =ff PRINT ARGthe input for this action is the scalar output from one or more other actions. =__FILL__ STRIDEcompulsory keyword ( default=1 ) the frequency with which the quantities of interest should be output =25 FILEthe name of the file on which to output these quantities =_PREFIX_.colvars.dat
Try to bias either the x or y directions separately. Try biasing a combination of them. We biased the average of x*y to be = 1. Use the CUSTOM command to try that out. What do you think it should look like? Write a python program to histogram the x and y data and see. It should look like below.
Bias alanine dipeptide using gromacs and the input files provided in the github.
MOLINFO STRUCTUREcompulsory keyword a file in pdb format containing a reference structure. =./input.ala2.pdb phi: TORSION ATOMSthe four atoms involved in the torsional angle =@phi-2 psi: TORSION ATOMSthe four atoms involved in the torsional angle =@psi-2 eds: EDS ARGthe input for this action is the scalar output from one or more other actions. =__FILL__ CENTERThe desired centers (equilibrium values) which will be sought during the adaptive linear biasing. =__FILL__ PERIODSteps over which to adjust bias for adaptive or ramping =__FILL__ OUT_RESTARTOutput file for all information needed to continue EDS simulation. =_PREFIX_.restart.dat BIAS_SCALEA divisor to set the units of the bias. =1 PRINT ARGthe input for this action is the scalar output from one or more other actions. =* STRIDEcompulsory keyword ( default=1 ) the frequency with which the quantities of interest should be output =500 FILEthe name of the file on which to output these quantities =_PREFIX_.colvars.dat
Try biasing phi and psi independently. Try biasing them at the same time. What is a good PERIOD to choose?
Take a protein of interest, or alanine 2, and bias more than one variable. To try CGDS, choose the center of mass of some different parts of your protein. Can you bias the distance between these COMs and the angle between them at the same time? Does using COVAR or LM affect the speed of convergence?
 1.8.17